
Measuring Program Impact: Incident Management
Discover the key metrics that showcase the value of your incident management program — at each stage of maturity


Organizations today face risks that can halt operations instantly — from workplace violence to insider threats to other disruptive events. Incident management isn’t just about logging what happens; it’s about enabling faster response, minimizing costs, and keeping the business running.
The challenge is that when incident management works well, disruptions are minimized — making its impact invisible to leaders deciding where to invest. The key to proving value is translating your results into the business metrics executives care about most: resilience, risk reduction, cost savings, and time efficiency. By framing program impact in these terms — and showing progress from foundational to optimized maturity — you turn security from a cost center into a strategic advantage.
Connecting to the four business metrics that matter
Incident management program metrics should ultimately ladder up to the four business metrics that matter most to executives and impact the company at the highest level. These metrics will help you frame incident management not as a tactical function but as an underlying driver of business outcomes.
Within each of the four categories, three maturity stages — foundational, evolving, and optimized — allow you to track progress over time. This approach ensures that your metrics remain realistic for your current stage while highlighting how your program delivers increasing value as it matures. In the sections that follow, we’ll connect each maturity stage to the four business metrics, giving you a clear framework to demonstrate impact in terms that leaders will recognize.
The framework below highlights the key incident management business driver metrics, organized by maturity level.
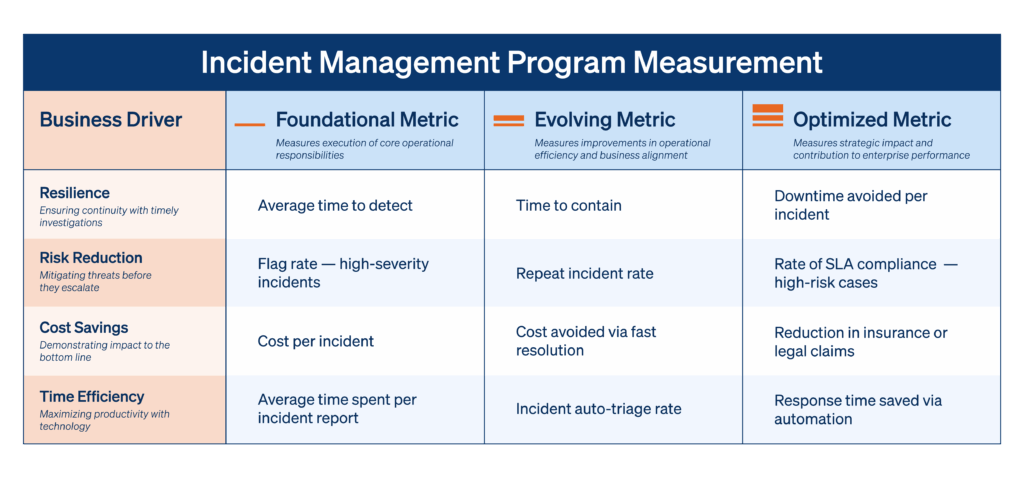
Let’s walk through each of these metrics in more detail.
01
Resilience metrics
A resilient incident management program ensures continuity, even when crises arise. This means detecting incidents quickly, containing their impact, and reducing downtime — all without disrupting core business goals.

Average time to detect
- What it is: The time between incident occurrence and detection.
- How to track it: Record incident start times (when they occurred or were reported) and the moment of detection. Calculate averages across incidents.
- Why it matters to the business: Faster detection reduces the window of exposure, limits potential damage, and minimizes the business impact of incidents before they escalate.

Time to contain
- What it is: The time between incident detection and containment.
- How to track it: Measure the time from initial detection until the incident is neutralized or contained.
- Why it matters to the business: Quick containment prevents incidents from spreading, protecting critical systems, data, and revenue streams from prolonged disruption.

Downtime avoided per incident
- What it is: It represents the amount of downtime that was prevented (not experienced) because an incident was handled effectively.
- How to track it: Compare actual downtime against potential downtime without containment. Quantify both time saved and cost avoided.
- Why it matters to the business: Proves that effective incident response keeps operations running and revenue intact — validating your program as a continuity enabler.
Imagine a regional protest blocks access to your headquarters, threatening a full-day shutdown. Facilities projected 12 hours of downtime. Because your team had early awareness and proactively enacted rerouting and remote-work contingencies, operations were restored in just 2 hours. That means 10 hours of disruption were avoided — an 83% productivity savings — demonstrating how your incident response directly sustained business continuity.
02
Risk reduction metrics
Risk reduction is all about surfacing and resolving incidents in ways that minimize recurrence and exposure.
Flag rate — high-severity incidents
- What it is: How often incidents are correctly identified as high-severity.
- How to track it: Track the number of high-severity incidents detected and logged, then calculate the percentage of total incidents they represent.
- Why it matters to the business: Shows that you’re able to identify and prioritize the most critical risks quickly, reducing the chance of major disruptions and proving your ability to focus resources where the stakes are highest.
Repeat incident rate
- What it is: The recurrence of issues that should ideally have been fixed the first time.
- How to track it: Measure the proportion of incidents that recur within a set timeframe.
- Why it matters to the business: A low repeat incident rate signals strong root cause analysis and mitigation processes, lowering the chance of small issues escalating into critical outages.
Rate of SLA compliance — high-risk cases
- What it is: An SLA (service level agreement) defines the maximum response and resolution times promised for incidents. Rate of SLA compliance — high-risk cases is the percentage of critical incidents that were resolved within the agreed SLA window.
- How to track it: Define SLAs for incident resolution and track the number of high-risk cases resolved within those timelines.
- Why it matters to the business: Shows your team’s ability to handle critical risks within expected thresholds — boosting confidence in enterprise risk posture.
Let’s say you’ve set a 24-hour SLA for resolving high-risk workplace violence threats. Last quarter, 92% of these cases were contained within that window, compared to just 65% the year before. This 42% relative increase in performance demonstrates your ability to consistently manage serious risks within expected thresholds, strengthening leadership’s confidence in your risk posture while providing trend data that guides future risk mitigation strategies.


03
Cost savings metrics
Incident management programs can deliver meaningful financial benefits — from reducing operational losses to avoiding legal and insurance costs.
Cost per incident
- What it is: The average financial impact of handling an incident from start to finish.
- How to track it: Sum total costs of each incident (investigation time, remediation, losses) and calculate averages.
- Why it matters to the business: Establishes transparency around incident-related expenses and sets a baseline for improvement. A declining cost per incident indicates the team is resolving faster, smarter, and with fewer resources.
Estimated cost avoided via fast resolution
- What it is: Estimates the financial losses the business did not incur because an incident was resolved quickly before it escalated.
- How to track it: Identify incidents where rapid containment prevented escalation. Estimate avoided costs with finance or risk teams.
- Why it matters to the business: Faster resolution minimizes lost transactions, customer churn, and reputational harm — demonstrating the tangible financial value of rapid response and strong incident management processes.
Trend in reduced insurance or legal claims
- What it is: Monitors the downward trend over time in the number or cost of insurance and legal claims related to incidents (like compliance failures or workplace safety issues).
- How to track it: Monitor the frequency and dollar value of claims tied to incidents across reporting periods, then chart the trend line to demonstrate reductions.
- Why it matters to the business: Fewer claims mean lower payouts, reduced insurance premiums, and less money tied up in legal settlements— proving that strong incident management and preventive controls directly cut financial risk.
Let’s say that two years ago, your company averaged a dozen slip-and-fall injury claims annually, costing over $1 million in settlements. Since implementing consistent incident reporting and corrective action tracking, claims have decreased by 75%, cutting associated payouts by more than 50% and demonstrating measurable liability reduction.
04
Time efficiency metrics
Time-efficiency metrics measure the amount of team effort and labor hours required to handle incidents, as well as the time saved through automation, efficient workflows, or proactive detection. Streamlined reporting, triage, and automation free teams to focus on proactive risk mitigation.
Average time per incident report
- What it is: The average amount of team time spent documenting and filing an incident report
- How to track it: Record the time required to complete each report, then calculate the average across all reports in a given period.
- Why it matters to the business: Reducing reporting time through templates or automation saves staff hours, increases efficiency, and ensures focus remains on resolving and preventing incidents.
Incident auto-triage rate
- What it is: Measures the percentage of incidents that are automatically triaged without manual intervention.
- How to track it: Compare the number of incidents processed through automated triage tools or AI systems against the total number of incidents in a given period.
- Why it matters to the business: A higher auto-triage rate reduces manual effort, speeds up response times, and ensures consistent prioritization, freeing staff to focus on resolving critical issues and improving overall efficiency.
Response time saved via automation
- What it is: Captures the amount of time incident response teams save when automation handles tasks that would otherwise require manual effort.
- How to track it: Estimate the average manual time needed for key response steps (like intake or investigation), subtract the actual time when automated, and total the time saved across incidents.
- Why it matters to the business: Demonstrates the ROI of automation by reducing response delays, lowering labor costs, and ensuring faster containment of high-risk incidents, which protects revenue and customer trust.
For example, when an employee badges into a restricted area after hours, your system auto-generates an incident, triggers notifications, and assigns tasks in under five minutes. Previously, this process required manual triage and took more than 60 minutes. By automating response, you’ve cut resolution time by more than 90%, saving dozens of staff hours each month while ensuring faster containment of potential risks.
Build momentum one step at a time
By connecting your incident management program to resilience, risk reduction, cost savings, and efficiency, you turn security into strategy. That’s how leaders see impact — and why they’ll want to invest. Measuring the value of incident management doesn’t require advanced dashboards or perfect workflows. Pick one metric today to start tracking. Be consistent, and see how trends evolve over time.
Then ask: what’s the “so what?” Maybe your team reduced the average time to detect by 40%. Or perhaps automation saved 200 hours last quarter. Those stats prove resilience, cost avoidance, and risk reduction.
When you frame insights in business terms, you show how incident management is not just a security function — it’s a strategic advantage. Start small, stay consistent, and let the data speak for itself.