
Measuring Program Impact: Executive Protection
Whether you’re just getting started or already tracking key metrics, here’s how to measure the impact of your program


Violence against executives is becoming increasingly normalized online — from doxxing to open conversations about physical harm. As these threats grow more visible, executives are becoming more aware of their personal risk and, in turn, paying closer attention to the performance of their executive protection teams. The challenge? When your EP program is doing everything right, nothing happens — which can make your success invisible just when leadership is finally looking.
That’s why demonstrating the business impact of your EP program through clear, executive-level metrics is more crucial than ever. Whether you’re building from scratch or running a mature program, translating the data you’re already tracking into the language leaders care about — the “so what” — can be exactly what’s needed to drive ongoing investment in your team and the resources you need to succeed.
Connecting to the four business metrics that matter
The metrics you track should ultimately ladder up to the four business metrics that matter most to executives: resilience, risk reduction, cost savings, and time efficiency. These represent the clearest indicators of business impact, framing incident management not as a tactical function, but as a driver of business performance.
Within each of these four categories, there are levels of maturity — foundational, evolving, and optimized — that you can use to track progress over time. This ensures you’re not just measuring for the sake of reporting, but actually showing growth in capability and demonstrating how your program delivers increasing value as it matures. In the sections that follow, we’ll map each maturity stage to the four business metrics, giving you a framework to prove impact in terms leaders will recognize.
The framework below highlights the key executive protection business driver metrics, organized by maturity level.
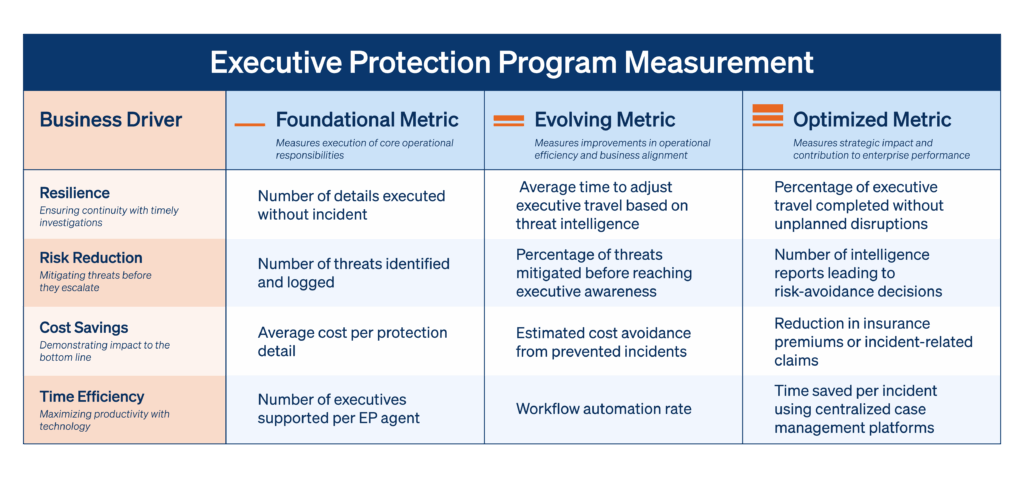
Let’s walk through each of these metrics in more detail.
01
Resilience metrics
A resilient EP program ensures continuity, even when threats arise. This might mean rapidly adjusting travel plans, responding to doxxing incidents, or rerouting personnel during civil unrest — all without disrupting the executive’s business goals and mitigating personnel risk.

Number of details executed without incident
- What it is: This measures the count of completed protection assignments where no safety or security incident occurred.
- How to track it: Maintain logs of all executive protection details. Document outcomes for each, specifically noting any incidents or deviations from plans.
- Why it matters to the business: Demonstrates a foundation of core competence in logistics, planning, and risk mitigation. Builds early trust with leadership by showing consistency and control.

Average time to adjust executive travel based on threat intelligence
- What it is: This measures how quickly your team can respond to new or evolving threats and adjust executive travel accordingly.
- How to track it: Track timestamps for both threat detection (like a civil unrest alert) and travel plan adjustments (rerouting, cancellation, or support reallocation), then calculate the average response time across incidents over a set period.
- Why it matters to the business: Shows your ability to prevent disruption before it becomes a crisis that impacts business continuity and productivity.

Percentage of executive travel completed without unplanned disruptions
- What it is: This captures the overall success rate of executive travel that concludes on time and as planned, even amidst potential threats.
- How to track it: Log all executive travel instances and define and record any unplanned disruptions (like reroutes, delays, cancellations, missed engagements). Calculate the percentage of total trips that were disruption-free.
- Why it matters to the business: This metric demonstrates that your team is protecting people and their ability to perform critical business functions that drive continuity. Ultimately, it validates your team as a strategic business enabler, not just a security function.
As an example on the advanced level, let’s say your team supports 50 international trips in a quarter. By leveraging travel risk monitoring and real-time intelligence, you preemptively reroute or adjust plans to avoid disruptions in 12 of those cases. All 50 trips are completed on time and without interruption. That’s a 100% disruption-free record, thanks to strategic threat forecasting and intervention — something executives will absolutely see as highly valuable, especially if it helps them keep critical business meetings on track and avoids reputational risk and unwanted media attention.
02
Risk reduction metrics
Reducing risk isn’t just about reacting to threats — it’s about anticipating them. Leading EP teams today are using intelligence and monitoring to stay ahead of threat actors to prevent incidents before they create risk to the business.
Number of threats identified and logged
- What it is: This metric captures how many potential or active threats are documented by the EP team.
- How to track it: Log all identified threats, incidents, and anomalies in a centralized and standardized system. Review logs regularly for patterns and gaps.
- Why it matters to the business: Demonstrates foundational situational awareness and active monitoring. And it validates your team’s ability to surface relevant risk signals early.
Percentage of threats mitigated before reaching executive awareness
- What it is: This measures how many threats are handled without needing executive escalation or disruption.
- How to track it: Log which identified threats were fully mitigated by the EP team before executive involvement and calculate the percentage of threats resolved internally.
- Why it matters to the business: Highlights the team’s ability to neutralize risk without causing disruption or distracting executives — allowing them to focus on critical business issues.
Number of intelligence reports leading to risk-avoidance decisions
- What it is: This measures how often threat assessments directly influence strategic decisions or changes to executive plans.
- How to track it: Link intelligence reporting outputs to specific outcomes (like trip changes, location avoidance, stakeholder briefings) and document instances where EP recommendations drove business decisions.
- Why it matters to the business: This metric demonstrates that EP is informing broader risk decisions that contribute to continuity and growth — not just reacting to threats against individuals. It ultimately validates the value of protective intelligence in business operations.
Let’s walk through an example at the optimized level. Let’s say your threat intelligence team produces weekly executive risk briefs. In Q2, 15 reports directly lead to business decisions, like adjusting public appearances, delaying travel to volatile regions, or escalating law enforcement coordination. For example, maybe one report warns of a targeted protest at a high-visibility event, leading your team to recommend a virtual appearance instead, preventing reputational fallout and safety concerns.


03
Cost savings metrics
While the value of EP is often harder to quantify than something like fraud recovery, smart EP strategies can lead to real financial benefits, like avoiding costs tied to reputational damage, legal exposure, or canceled executive appearances.
Average cost per protection detail
- What it is: This measures the baseline cost of executing a standard protection assignment.
- How to track it: Aggregate all costs associated with each detail (personnel, travel, equipment, lodging, etc.) and divide the total cost by the number of details executed during the period. Track this across different types of assignments (domestic, international, event-based, etc.) for benchmarking.
- Why it matters to the business: Establishes transparency around EP spend and creates a baseline for evaluating efficiency. Decreasing this metric over time demonstrates how your team contributes to cutting costs for the company.
Estimated cost avoidance from prevented incidents
- What it is: This quantifies financial impact avoided through proactive interventions (like avoiding a canceled appearance or legal issue.)
- How to track it: Identify incidents where preemptive action prevented a larger disruption or loss. Work with finance, legal, or PR to estimate the cost of the avoided outcome (like missed investor meeting, breach of contract, reputational crisis).
- Why it matters: Translates your proactive efforts into tangible financial impact. It shows how timely interventions can protect the business from losses tied to canceled engagements, legal exposure, or reputational damage.
Reduction in insurance premiums or incident-related claims
- What it is: This captures long-term financial benefits resulting from improved risk posture and reduced incident frequency.
- How to track it: Monitor changes in insurance premiums over time, especially for travel and liability coverage. Track the number and cost of EP-related insurance claims annually. Correlate reductions with improvements in EP strategy, intelligence use, and incident prevention.
- Why it matters to the business: Demonstrates the sustained financial impact of a mature, intelligence-driven EP program by connecting long-term cost reductions — such as lower premiums or fewer claims — directly to the team’s efforts, proving EP is not just a protective service but a strategic driver of cost savings.
For example, suppose your company typically pays $2 million/year in premiums for executive liability and travel insurance. After two years of enhanced EP protocols, including stronger risk assessments, incident prevention, and threat mitigation, you successfully negotiate a 10% reduction in premiums due to your improved risk posture. That $200,000 in annual savings becomes a powerful argument for further investment in your EP program.
04
Time efficiency metrics
Executive protection is a 24/7 responsibility, and every hour saved matters. Whether it’s through improved workflows or automation, increasing efficiency helps teams scale their impact without burning out.
Number of executives supported per EP agent
- What it is: This measures how many principals each EP agent supports, indicating baseline resource load and operational structure.
- How to track it: Log the number of executives under active protection and divide by the number of full-time EP agents. Review changes over time to understand shifts in resource demands.
- Why it matters to the business: Establishes a baseline for workload and capacity planning. Demonstrating the ability to increase the number of executives supported per EP agent provides evidence of improved workflow efficiency, translating into significant time savings for the organization.
Use of digital forensics or AI tools for efficiency
- What it is: This metric measures the adoption of time-saving technologies that support tasks like evidence analysis, case triage, or pattern recognition.
- How to track it: Log usage of specific AI and automation tools, track adoption rate across team members and workflows, and measure time reduction or case acceleration where possible.
- Why it matters to the business: Demonstrates that your team is able to drive impact in less time — all without sacrificing quality or investing in greater headcount.
Time saved per incident using centralized case management platforms
- What it is: This quantifies how much time is saved per case or incident by using integrated, purpose-built platforms.
- How to track it: Compare incident response times before and after adoption of centralized platforms (like threat intelligence and case management systems). Record time spent per incident manually vs. with platform support. Calculate average time saved across a sample set of incidents or threat assessments.
- Why it matters to the business: By freeing the team to allocate time toward proactive planning, intelligence review, or stakeholder engagement, you demonstrate strategic efficiency gains tied directly to technology investments. This ultimately justifies increased investment in platforms that help centralize and accelerate response.
Suppose you handle an average of 30 incidents per month, ranging from travel plan changes to minor threats. Before, each incident took an average of 3 hours to document and coordinate using manual systems. After implementing a centralized case management platform with automated notifications and integrated intelligence tools, the time drops to 1.5 hours per incident. That’s 45 hours/month saved — equivalent to nearly two weeks of work you can redirect toward higher-priority tasks like proactive threat hunting.
Start small, show progress, earn buy-in
Measuring the value of executive protection doesn’t require new headcount, advanced dashboards, or perfect workflows. You can start today — and it’s simpler than you think. Pick one metric, track it on a regular cadence, and watch for patterns.
Once you start to see trends, ask yourself: what’s the “so what?” What does this data tell us that matters to the C-suite? Maybe it’s that your team executed 98% of the details without incident. Or that you’ve consistently adjusted travel within two hours of a threat — avoiding costly delays. That’s not just an operational stat — that’s business continuity, brand protection, and cost avoidance.
When you frame your insights in business terms, you show that EP is not just a cost center but a strategic advantage. Start small, stay consistent, and let the data speak for itself.